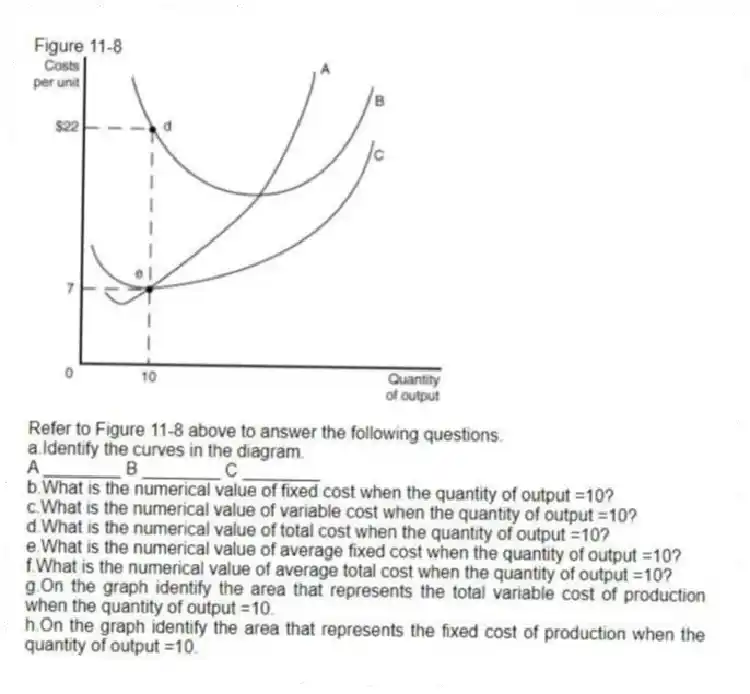
Figure 11-8
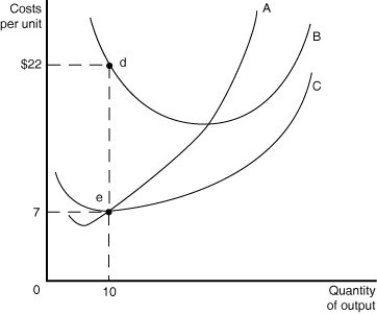
-Refer to Figure 11-8 above to answer the following questions.
a.Identify the curves in the diagram.
A ________ B ________ C ________
b.What is the numerical value of fixed cost when the quantity of output =10?
c.What is the numerical value of variable cost when the quantity of output =10?
d.What is the numerical value of total cost when the quantity of output =10?
e.What is the numerical value of average fixed cost when the quantity of output =10?
f.What is the numerical value of average total cost when the quantity of output =10?
g.On the graph identify the area that represents the total variable cost of production when the quantity of output =10.
h.On the graph identify the area that represents the fixed cost of production when the quantity of output =10.
Correct Answer:
Verified
View Answer
Unlock this answer now
Get Access to more Verified Answers free of charge
Q199: Table 11-7 Q200: Figure 11-6 Q201: A firm's short-run average total cost curve Q202: Suppose the total cost of producing 40,000 Q203: Figure 11-9 Q205: Explain how the listed events (a-d)would affect Unlock this Answer For Free Now! View this answer and more for free by performing one of the following actions Scan the QR code to install the App and get 2 free unlocks Unlock quizzes for free by uploading documents
![]()
![]()
![]()

