
Figure 11-11
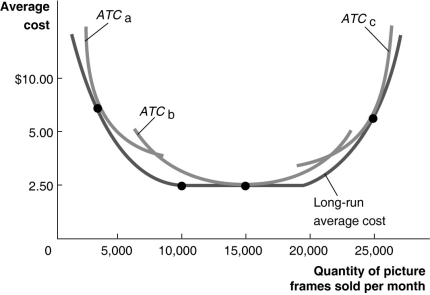
Figure 11-11 illustrates the long-run average cost curve for a firm that produces picture frames. The graph also includes short-run average cost curves for three firm sizes: ATCₐ, ATCb and ATCc.
-Refer to Figure 11-11.In the short run, if the firm sells fewer than 5,000 picture frames per month,
A) it should produce with the scale of operation associated with ATCₐ.
B) it should produce with the scale of operation associated with ATCb.
C) it should produce with the scale of operation associated with ATCc.
D) it will experience constant returns to scale.
Correct Answer:
Verified
Q238: The minimum efficient scale is
A)the level of
Q239: Which of the following is a reason
Q240: If, when a firm doubles all its
Q241: In the long run, the relevant cost
Q242: Diseconomies of scale occur when
A)long-run average costs
Q244: Table 11-8 Q245: Figure 11-11 Q246: Two stores-Lazy Guys and Ralph's Recliners-are located Q247: Table 11-8 Q248: A curve showing the lowest cost at Unlock this Answer For Free Now! View this answer and more for free by performing one of the following actions Scan the QR code to install the App and get 2 free unlocks Unlock quizzes for free by uploading documents
![]()
![]()
![]()

