Multiple Choice
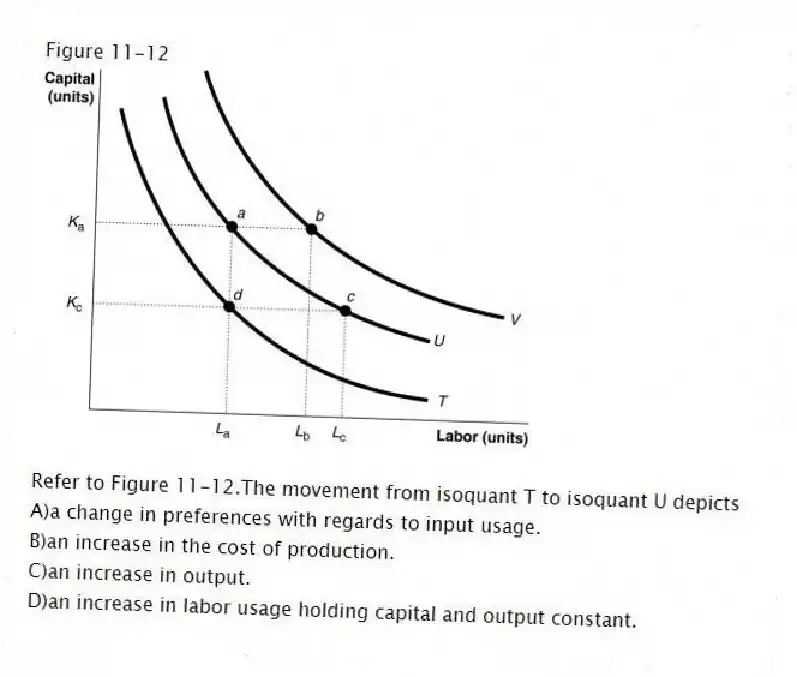
Figure 11-12
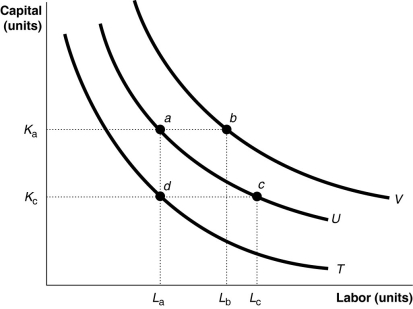
-Refer to Figure 11-12.The movement from isoquant T to isoquant U depicts
A) a change in preferences with regards to input usage.
B) an increase in the cost of production.
C) an increase in output.
D) an increase in labor usage holding capital and output constant.
Correct Answer:
Verified
Related Questions
Q277: An isoquant shows
A)the combinations of two goods
Q278: What is the difference between total cost
Q279: State the law of diminishing returns.How do
Q280: Minimum efficient scale is defined as the

