
Figure 11-13
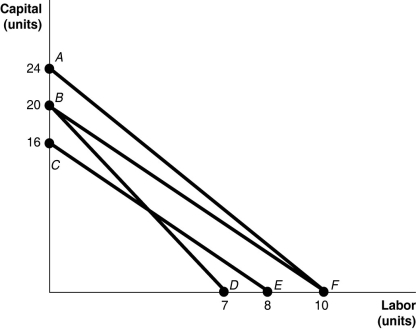
-Refer to Figure 11-13.The lines shown in the diagram are isocost lines.If the price of labor is $50 per unit, what is the price of capital along the isocost CE?
A) $400 per unit
B) $100 per unit
C) $25 per unit
D) insufficient information to answer question
Correct Answer:
Verified
Q280: Minimum efficient scale is defined as the
Q281: Figure 11-13 Q282: Figure 11-12 Q283: Figure 11-14 Q284: The rate at which a firm is Q286: Suppose the price of capital and labor Q287: A curve that shows all the combinations Q288: An expansion path shows Q289: Figure 11-13 Q290: Figure 11-15 Unlock this Answer For Free Now! View this answer and more for free by performing one of the following actions Scan the QR code to install the App and get 2 free unlocks Unlock quizzes for free by uploading documents
![]()
![]()
![]()
A)the level of sales
![]()
![]()

