Multiple Choice

Figure 12-6
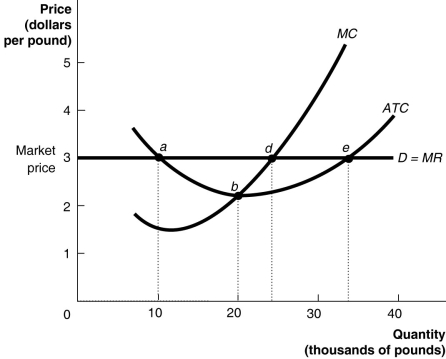
Figure 12-6 shows the demand, marginal cost (MC) and average total cost (ATC) curves for Jason's House of Apples.
-Refer to Figure 12-6.To maximize his profit, Jason should produce the level of output indicated by point
A) a.
B) b.
C) e.
D) d.
Correct Answer:
Verified
Related Questions
Q118: Article Summary
According to the Department of Agriculture,
Q119: Figure 12-4 Q120: Figure 12-5 Q121: A firm will make a profit when Q122: A firm will break even when
![]()
![]()
A)P
A)P =

