Multiple Choice
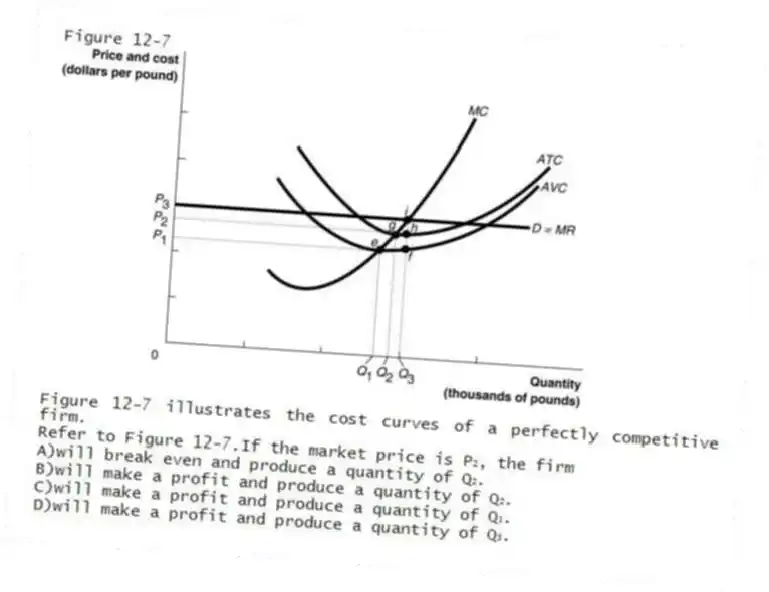
Figure 12-7
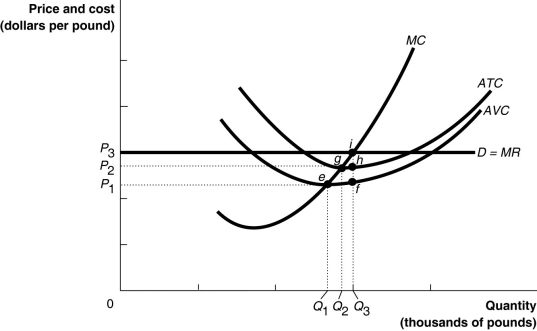
Figure 12-7 illustrates the cost curves of a perfectly competitive firm.
-Refer to Figure 12-7.If the market price is P₂, the firm
A) will break even and produce a quantity of Q₂.
B) will make a profit and produce a quantity of Q₂.
C) will make a profit and produce a quantity of Q₁.
D) will make a profit and produce a quantity of Q₃.
Correct Answer:
Verified
Related Questions

