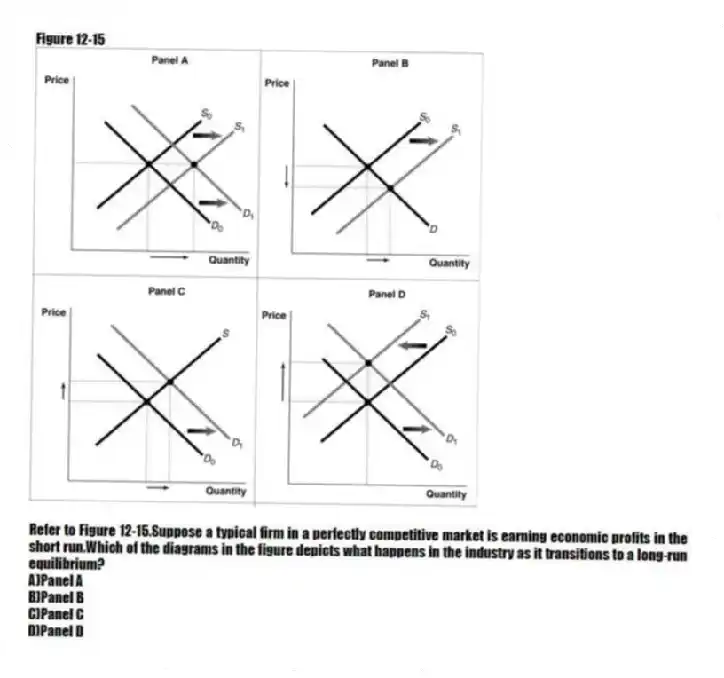
Figure 12-15
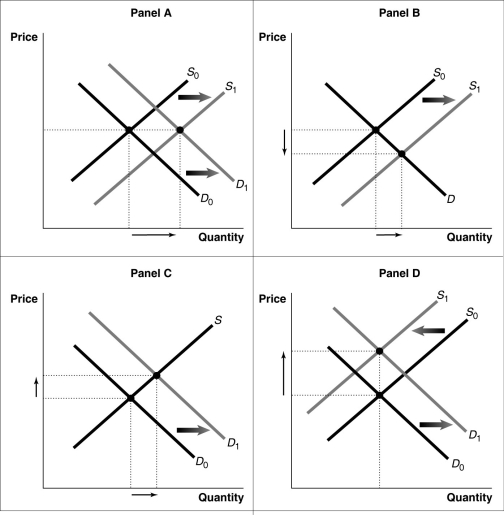
-Refer to Figure 12-15.Suppose a typical firm in a perfectly competitive market is earning economic profits in the short run.Which of the diagrams in the figure depicts what happens in the industry as it transitions to a long-run equilibrium?
A) Panel A
B) Panel B
C) Panel C
D) Panel D
Correct Answer:
Verified
Q220: Figure 12-11 Q221: Figure 12-16 Q222: The long-run supply curve for a perfectly Q223: In August 2008, Ethan Nicholas developed the Q224: Figure 12-16 Q226: A constant-cost industry is an industry in Q227: In the long run, a perfectly competitive Q228: An industry's long-run supply curve shows Q229: Figure 12-16 Q230: In a perfectly competitive industry, in the Unlock this Answer For Free Now! View this answer and more for free by performing one of the following actions Scan the QR code to install the App and get 2 free unlocks Unlock quizzes for free by uploading documents
![]()
![]()
![]()
A)the relationship
![]()

