Figure 12-17
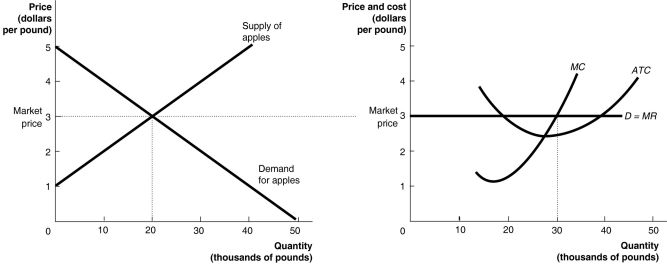
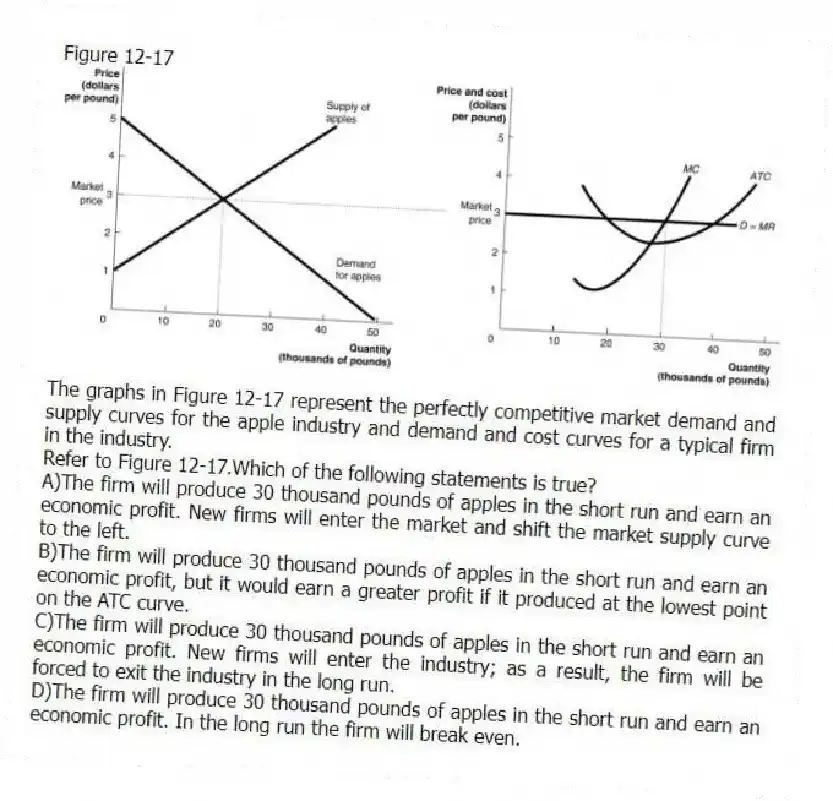
The graphs in Figure 12-17 represent the perfectly competitive market demand and supply curves for the apple industry and demand and cost curves for a typical firm in the industry.
-Refer to Figure 12-17.Which of the following statements is true?
A) The firm will produce 30 thousand pounds of apples in the short run and earn an economic profit. New firms will enter the market and shift the market supply curve to the left.
B) The firm will produce 30 thousand pounds of apples in the short run and earn an economic profit, but it would earn a greater profit if it produced at the lowest point on the ATC curve.
C) The firm will produce 30 thousand pounds of apples in the short run and earn an economic profit. New firms will enter the industry; as a result, the firm will be forced to exit the industry in the long run.
D) The firm will produce 30 thousand pounds of apples in the short run and earn an economic profit. In the long run the firm will break even.
Correct Answer:
Verified
Q251: If, as a perfectly competitive industry expands,
Q252: A firm could continue to operate for
Q253: A perfectly competitive firm in a constant-cost
Q254: A perfectly competitive firm in a constant-cost
Q255: Competition has driven the economic profits in
Q257: In a decreasing-cost industry, the entry of
Q258: Assume that a perfectly competitive market is
Q259: Hogrocket, which developed the Tiny Invaders game
Q260: Assume that firms in a perfectly competitive
Q261: What is productive efficiency?
A)a situation in which
Unlock this Answer For Free Now!
View this answer and more for free by performing one of the following actions

Scan the QR code to install the App and get 2 free unlocks

Unlock quizzes for free by uploading documents