
Figure 12-17
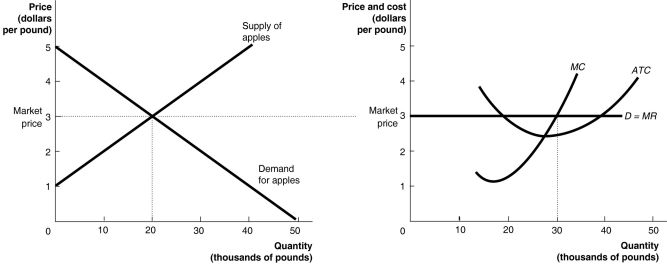
The graphs in Figure 12-17 represent the perfectly competitive market demand and supply curves for the apple industry and demand and cost curves for a typical firm in the industry.
-Refer to Figure 12-17.The graphs depict a short-run equilibrium.How will this differ from the long-run equilibrium? (Assume this is a constant-cost industry.)
A) Fewer firms will be in the market in the long run than in the short run.
B) The price will be higher in the long run than in the short run.
C) The market supply curve will be further to the left in the long run than in the short run.
D) The firm's profit will be lower in the long run than in the short run.
Correct Answer:
Verified
Q201: After an increase in demand in a
Q241: If in the long run a firm
Q242: If a firm in a perfectly competitive
Q243: Suppose there are economies of scale in
Q244: What characteristic of a competitive market has
Q245: In an increasing-cost industry the long-run supply
Q247: A firm would decide to shut down
Q249: If, as a perfectly competitive industry expands,
Q250: Figure 12-17 Q251: If, as a perfectly competitive industry expands,
![]()
Unlock this Answer For Free Now!
View this answer and more for free by performing one of the following actions

Scan the QR code to install the App and get 2 free unlocks

Unlock quizzes for free by uploading documents