Multiple Choice
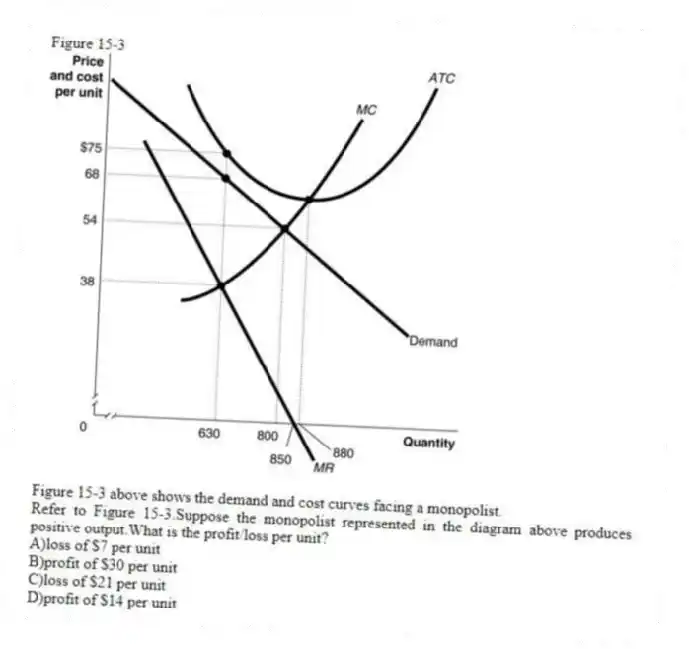
Figure 15-3

Figure 15-3 above shows the demand and cost curves facing a monopolist.
-Refer to Figure 15-3.Suppose the monopolist represented in the diagram above produces positive output.What is the profit/loss per unit?
A) loss of $7 per unit
B) profit of $30 per unit
C) loss of $21 per unit
D) profit of $14 per unit
Correct Answer:
Verified
Related Questions

