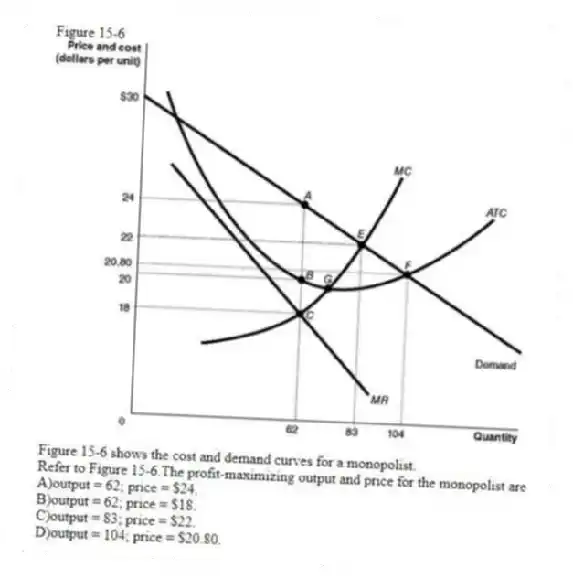
Figure 15-6
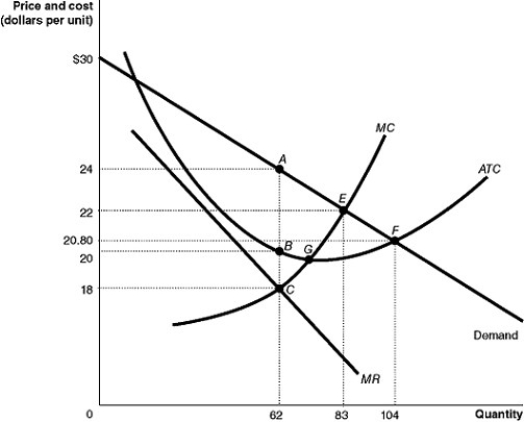
Figure 15-6 shows the cost and demand curves for a monopolist.
-Refer to Figure 15-6.The profit-maximizing output and price for the monopolist are
A) output = 62; price = $24.
B) output = 62; price = $18.
C) output = 83; price = $22.
D) output = 104; price = $20.80.
Correct Answer:
Verified
Q132: Figure 15-5 Q133: The demand curve for a monopoly firm Q134: To maximize profit, a monopolist will produce Q135: If a monopolist's marginal revenue is $35 Q136: Figure 15-6 Q138: Which of the following statements is true? Q139: To maximize profit a monopolist will produce Unlock this Answer For Free Now! View this answer and more for free by performing one of the following actions Scan the QR code to install the App and get 2 free unlocks Unlock quizzes for free by uploading documents
![]()
A)is
![]()
A)Monopolists

