
Figure 15-16
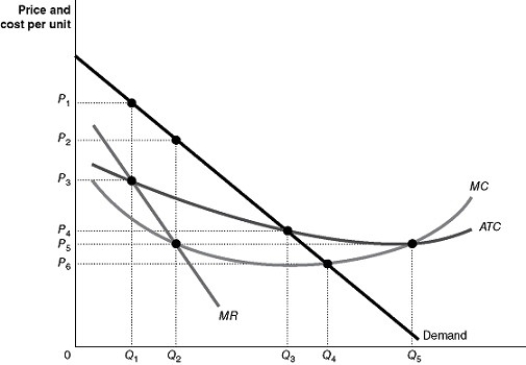
Figure 15-16 shows the market demand and cost curves facing a natural monopoly.
-Refer to Figure 15-16.Which of the following would be true if government regulators require the natural monopoly to produce at the economically efficient output level?
A) This results in a misallocation of resources.
B) The marginal cost of producing the last unit sold exceeds the marginal benefit.
C) The firm will sustain persistent losses and will not continue in business in the long run.
D) The firm will break even.
Correct Answer:
Verified
Q255: Figure 15-17 Q256: Economists played a key role in the Q257: According to the Department of Justice merger Q258: Consider an industry that is made up
![]()
Unlock this Answer For Free Now!
View this answer and more for free by performing one of the following actions

Scan the QR code to install the App and get 2 free unlocks

Unlock quizzes for free by uploading documents