
Figure 15-16
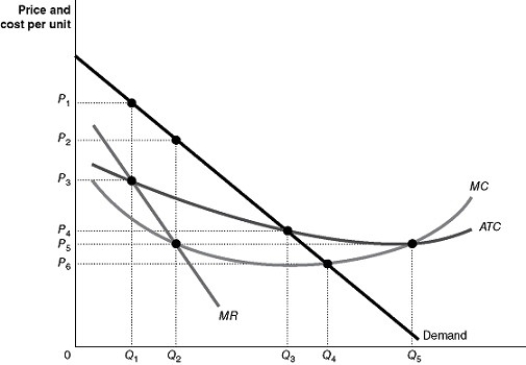
Figure 15-16 shows the market demand and cost curves facing a natural monopoly.
-Refer to Figure 15-16.If the regulators of the natural monopoly allow the owners of the firm to break even on their investment the firm will produce an output of ________ and charge a price of ________.
A) Q₁ units; P₄
B) Q₁ units; P₁
C) Q₅ units; P₃
D) Q₃ units; P₄
Correct Answer:
Verified
Q249: The Herfindahl-Hirschman Index is one factor used
Q250: Figure 15-17 Q251: Congress has divided the authority to police Q252: Which two factors make regulating mergers complicated? Q253: Figure 15-16 Q255: Figure 15-17 Q256: Economists played a key role in the Q257: According to the Department of Justice merger Q258: Consider an industry that is made up Q259: Figure 15-17 Unlock this Answer For Free Now! View this answer and more for free by performing one of the following actions Scan the QR code to install the App and get 2 free unlocks Unlock quizzes for free by uploading documents
![]()
A)First,
![]()
![]()
![]()

