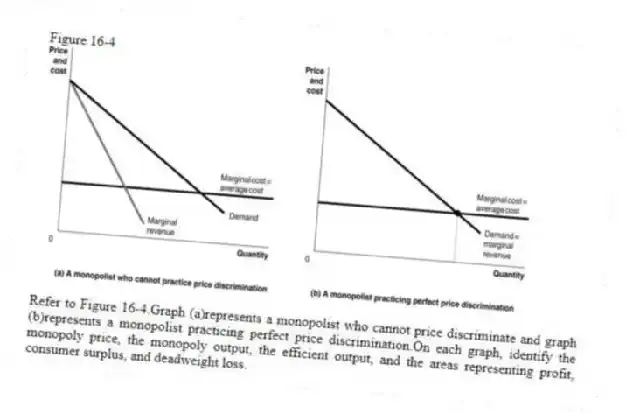
Figure 16-4
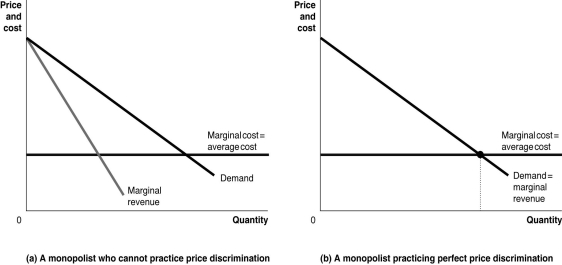
-Refer to Figure 16-4.Graph (a)represents a monopolist who cannot price discriminate and graph (b)represents a monopolist practicing perfect price discrimination.On each graph, identify the monopoly price, the monopoly output, the efficient output, and the areas representing profit, consumer surplus, and deadweight loss.
Correct Answer:
Verified
View Answer
Unlock this answer now
Get Access to more Verified Answers free of charge
Q159: If a monopolist engages in first-degree price
Q160: Article Summary
Brandeis University economist Benjamin Shiller has
Q161: What is perfect price discrimination and why
Q162: Some firms practice odd pricing because
A)they believe
Q163: Perfect price discrimination will lead a firm
Q165: Book publishers often use price discrimination across
Q166: The Clayton Act of 1936 outlawed price
Q167: Draw a graph that shows producer surplus,
Q168: Delaware and North Dakota have identical state
Q169: What is yield management? How is yield
Unlock this Answer For Free Now!
View this answer and more for free by performing one of the following actions

Scan the QR code to install the App and get 2 free unlocks

Unlock quizzes for free by uploading documents