Multiple Choice
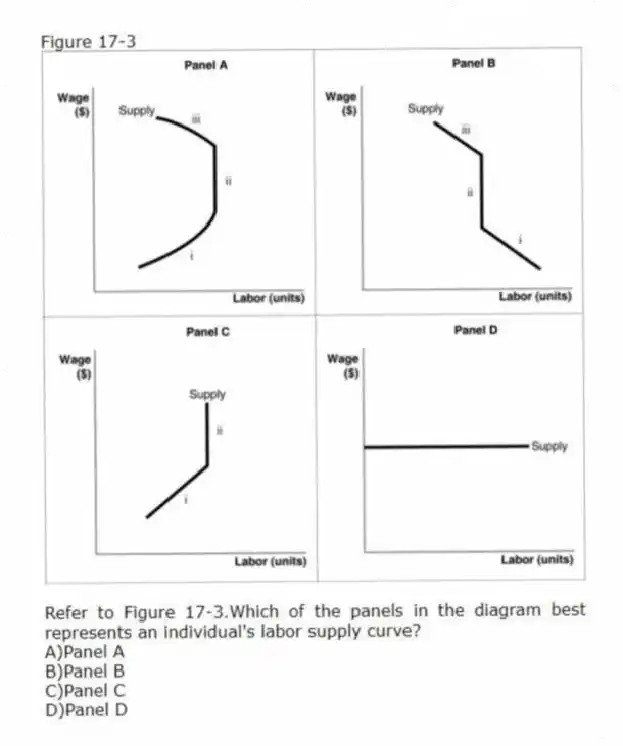
Figure 17-3
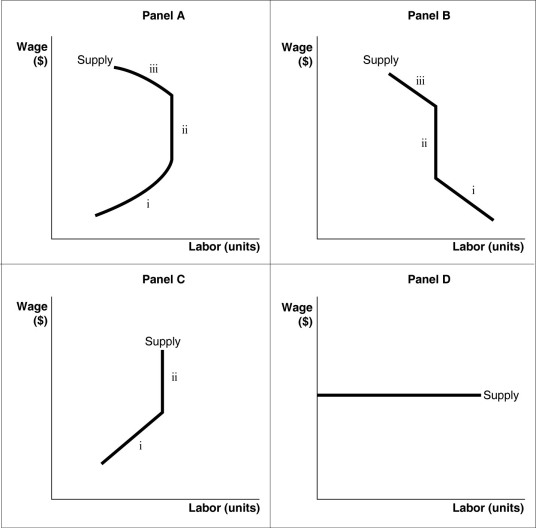
-Refer to Figure 17-3.Which of the panels in the diagram best represents an individual's labor supply curve?
A) Panel A
B) Panel B
C) Panel C
D) Panel D
Correct Answer:
Verified
Related Questions
Q87: All of the following will shift the
Q88: Table 17-5 Q89: An increase in the supply of capital, Q90: Which of the following best explains why Q91: Explain how the market for opticians is Q93: A firm's labor demand curve is also
![]()
Unlock this Answer For Free Now!
View this answer and more for free by performing one of the following actions

Scan the QR code to install the App and get 2 free unlocks

Unlock quizzes for free by uploading documents