Multiple Choice

Figure 52.3 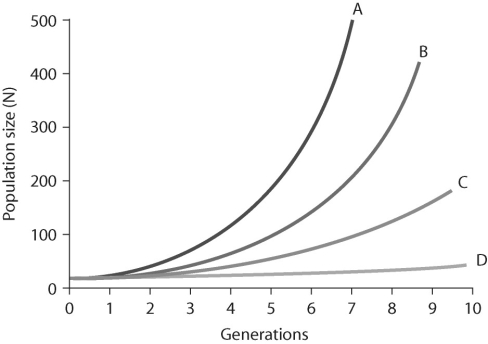
-In Figure 52.3,which of the lines represents the highest per-capita rate increase (r) ?
A) line A
B) line B
C) line C
D) line D
Correct Answer:
Verified
Related Questions
Q2: Figure 52.2 Q3: Figure 52.4 Q5: Figure 52.1 Q8: Which of these terms defines how the Q10: Figure 52.3 Q11: You observe two female fish of the Unlock this Answer For Free Now! View this answer and more for free by performing one of the following actions Scan the QR code to install the App and get 2 free unlocks Unlock quizzes for free by uploading documents![]()
![]()
![]()
![]()

