Multiple Choice

Figure 52.8 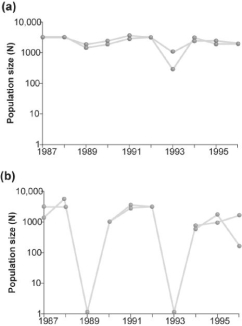
-Which of the two graphs in Figure 52.8 shows a population of organisms that has a strong population cycle?
A) (a)
B) (b)
Correct Answer:
Verified
Related Questions
Q22: Figure 52.12 Q23: Figure 52.11 Q24: Figure 52.6 Q25: Suppose researchers marked 800 turtles and later![]()
![]()
![]()

