Short Answer

Figure 52.10 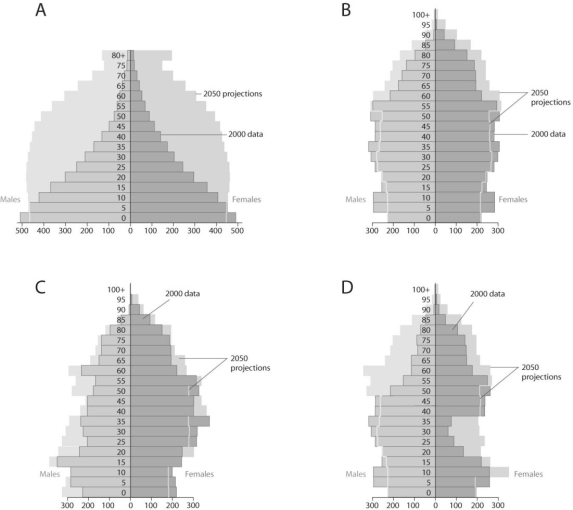
-Based on the diagrams in Figure 52.10 and on the large population of baby boomers in the United States,what graph best reflects U.S.population in 20 years?
Correct Answer:
Verified
Related Questions
Q9: What is the primary limiting factor that
Q16: Figure 52.5 Q17: Figure 52.1 Q18: Why can't a female lizard have both Q19: It is estimated that snow geese will![]()
![]()

