
Figure 55.5 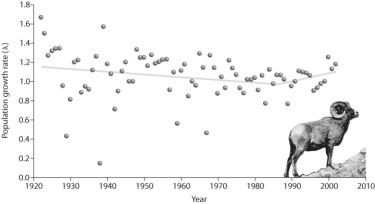
-According to Figure 55.5,what is the least likely explanation for the data after 1985?
A) emigration
B) immigration
C) introduction of new individuals to the population
D) increased resources in the area
Correct Answer:
Verified
Q29: A land developer is arguing with a
Q30: On Easter Island,data show that it was
Q31: Figure 55.7 Q32: What is the main difference between sustainable Q33: The habitat of your bat population (in Q35: Which of the following statements regarding species Q36: Which of the following criteria have to Q37: Researchers have been studying a rare population Q38: Figure 55.8 Use the following information when Q39: Figure 55.6 ![]()
![]()
Unlock this Answer For Free Now!
View this answer and more for free by performing one of the following actions

Scan the QR code to install the App and get 2 free unlocks

Unlock quizzes for free by uploading documents