Solved

Figure 2.3 -In Figure 2.3, the Initial Demand Curve Is D1 and Curve

Question 115

Multiple Choice
Figure 2.3
 
-In Figure 2.3, the initial demand curve is D<sub>1</sub> and the supply curve is S<sub>1</sub>. If the price of a substitute good increases, what is the most likely result?

Figure 2.3
Figure 2.3    -In Figure 2.3, the initial demand curve is D<sub>1</sub> and the supply curve is S<sub>1</sub>. If the price of a substitute good increases, what is the most likely result? A)  Demand will shift to D<sub>2</sub>. B)  Equilibrium will move from A to E. C)  Equilibrium will move from A to C. D)  Equilibrium will move from A to D. E)  Demand will shift to D<sub>3</sub>.
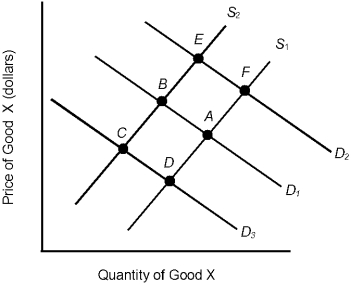
-In Figure 2.3, the initial demand curve is D1 and the supply curve is S1. If the price of a substitute good increases, what is the most likely result?


A) Demand will shift to D2.
B) Equilibrium will move from A to E.
C) Equilibrium will move from A to C.
D) Equilibrium will move from A to D.
E) Demand will shift to D3.

Correct Answer:

verifed

Verified

Unlock this answer now
Get Access to more Verified Answers free of charge

Related Questions

Unlock this Answer For Free Now!

View this answer and more for free by performing one of the following actions

qr-code

Scan the QR code to install the App and get 2 free unlocks

upload documents

Unlock quizzes for free by uploading documents