
Figure 3.2
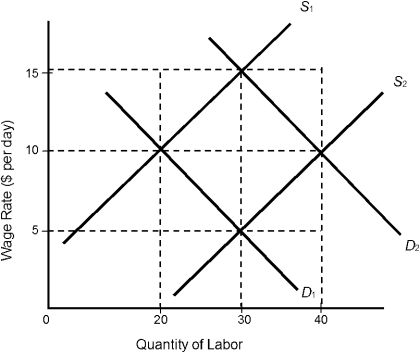
-In Figure 3.2, assume that we have labor market demand and supply curves of D1 and S2, respectively. What is the equilibrium wage and employment level?
A) $5; 30 workers
B) $10; 20 workers
C) $10; 40 workers
D) $15; 30 workers
E) $5; 20 workers
Correct Answer:
Verified
Q17: The compensating wage differential shows a labor
Q18: On a graph showing the supply and
Q19: As shown in the text, in the
Q20: Many companies have moved jobs from the
Q21: A compensating wage differential is a wage
Q23: In 1900 about _ of all Americans
Q24: If each of the following jobs paid
Q25: To be profitable in a free market,
Q26: An increase in the minimum wage, which
Q27: In 2005, the U.S. Department of Labor
Unlock this Answer For Free Now!
View this answer and more for free by performing one of the following actions

Scan the QR code to install the App and get 2 free unlocks

Unlock quizzes for free by uploading documents