Multiple Choice
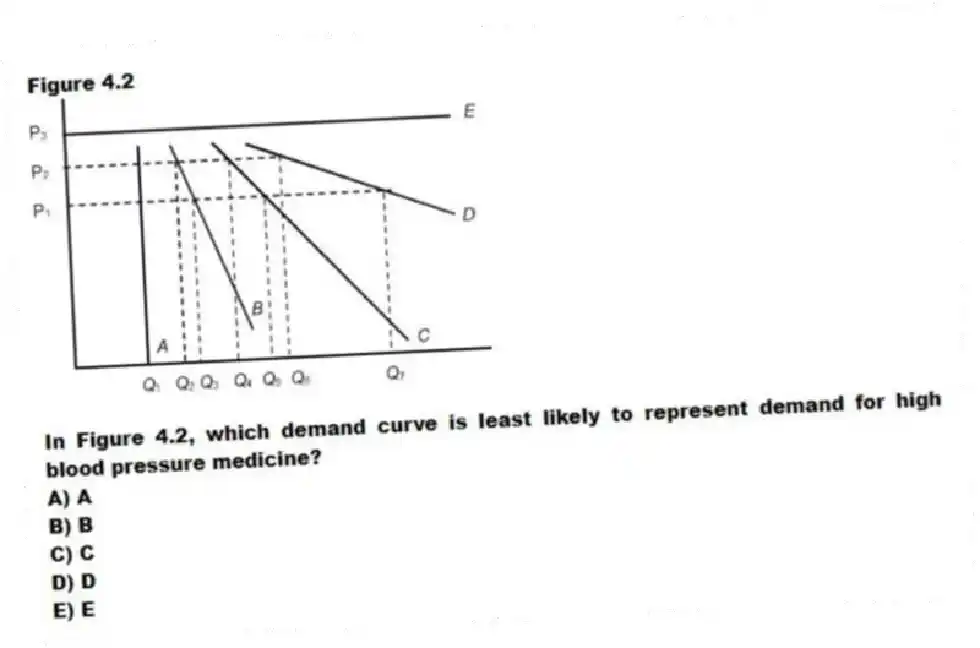
Figure 4.2
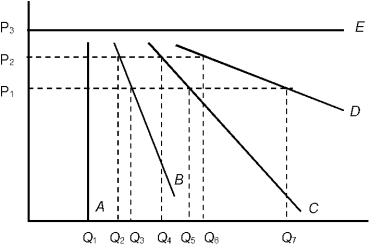
-In Figure 4.2, which demand curve is least likely to represent demand for high blood pressure medicine?
A) A
B) B
C) C
D) D
E) E
Correct Answer:
Verified
Related Questions
Q51: A price elasticity of demand equal to
Q52: Figure 4.2 Q53: Any change in price that causes a Q54: Figure 4.2 Q55: A horizontal demand curve is Q57: Figure 4.2 Q58: The demand for Pepsi _ the demand Q59: If electric rates were increased by 10 Q60: Figure 4.2 Q61: Which of the following is a characteristic Unlock this Answer For Free Now! View this answer and more for free by performing one of the following actions Scan the QR code to install the App and get 2 free unlocks Unlock quizzes for free by uploading documents
![]()
![]()
A) unit elastic.
B)
![]()
![]()

