
Figure 11.3
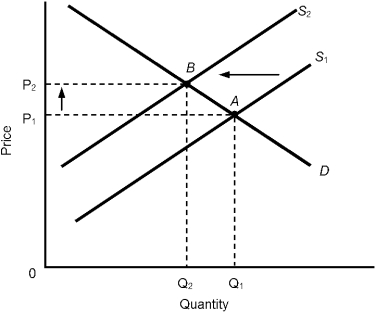
-Figure 11.3 represents the demand and supply conditions of an economy. The leftward shift in the supply curve could be explained by
A) decreases in oil supplies, like those experienced in the 1970s.
B) wage reductions by union members.
C) businesses reducing their profit margins.
D) discoveries of natural gas.
E) increased foreign demand for domestic products.
Correct Answer:
Verified
Q76: When inflation is much higher than expected,
Q87: When the real interest rate is less
Q88: A variable-rate mortgage
A) eliminates the risk of
Unlock this Answer For Free Now!
View this answer and more for free by performing one of the following actions

Scan the QR code to install the App and get 2 free unlocks

Unlock quizzes for free by uploading documents