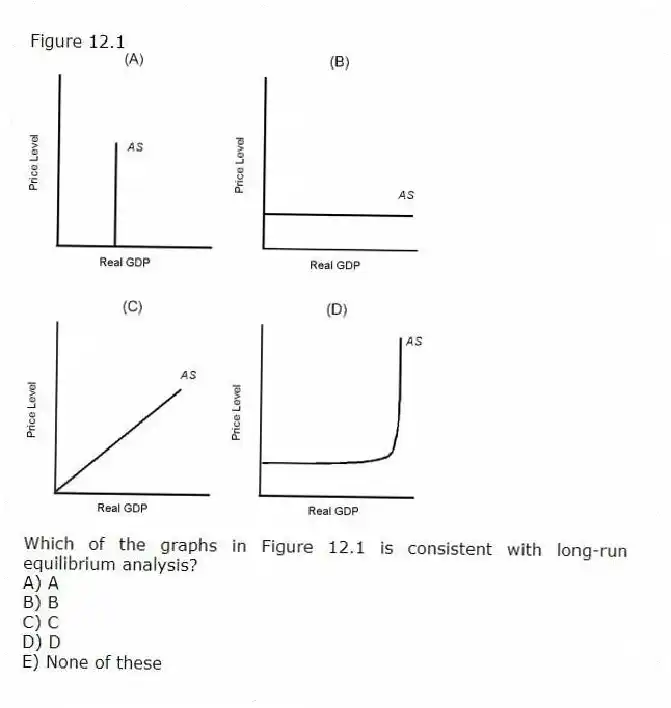
Figure 12.1
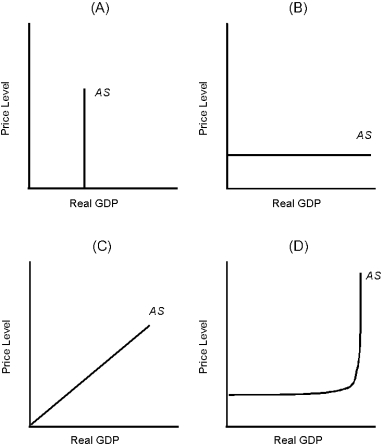
-Which of the graphs in Figure 12.1 is consistent with long-run equilibrium analysis?
A) A
B) B
C) C
D) D
E) None of these
Correct Answer:
Verified
Q44: The short-run aggregate supply curve is
A) a
Q45: Figure 12.1 Q46: The short-run aggregate supply curve shifts to Q47: Of the following, which is not held Q48: All of the following will cause the Q50: A leftward shift of the aggregate demand Q51: The upward-sloping aggregate supply curve represents Q52: The less vertical the aggregate supply curve, Q53: The long-run aggregate supply curve at the Q54: A decline in production costs
![]()
A) increases
A) reduces the
Unlock this Answer For Free Now!
View this answer and more for free by performing one of the following actions

Scan the QR code to install the App and get 2 free unlocks

Unlock quizzes for free by uploading documents