
Figure 12.2
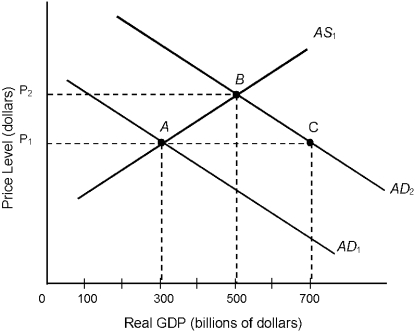
-Consider the economy described in Figure 12.2. At point A, equilibrium income equals
A) P1
B) P2
C) $300 billion.
D) $500 billion.
E) $700 billion.
Correct Answer:
Verified
Q72: In the mid-2000s, the price of oil
Q73: When we consider an upward-sloping aggregate supply
Q74: A simultaneous increase in both unemployment and
Q75: Figure 12.3 Q76: A decline in short-run aggregate supply would Q78: Figure 12.2 Q79: Figure 12.3 Q80: If both aggregate demand and short-run aggregate Q81: Government spending is set by the federal Q82: Figure 12.4 Unlock this Answer For Free Now! View this answer and more for free by performing one of the following actions Scan the QR code to install the App and get 2 free unlocks Unlock quizzes for free by uploading documents
![]()
![]()
![]()
![]()

