
Figure 15.1: Mexican Pesos per Dollar
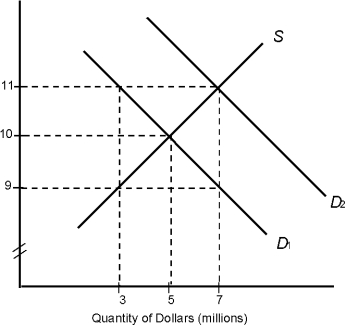
-Refer to Figure 15.1. If the market is illustrated by curves S and D2, the equilibrium exchange rate is
A) 11 pesos per dollar.
B) $11 per peso.
C) $10 per peso.
D) 10 pesos per dollar.
E) 9 pesos per dollar.
Correct Answer:
Verified
Q45: When the foreign exchange value of the
Q46: Which of the following would most likely
Q47: The buying and selling of government bonds
Q48: When the foreign exchange value of the
Q49: Figure 15.1: Mexican Pesos per Dollar
Q51: To fix the exchange rate (foreign currency
Q52: In foreign exchange markets, a Japanese investor
Q53: When the Federal Open Market Committee buys
Q54: The use of domestic open market operations
Q55: An increase in the discount rate
A) increases
Unlock this Answer For Free Now!
View this answer and more for free by performing one of the following actions

Scan the QR code to install the App and get 2 free unlocks

Unlock quizzes for free by uploading documents