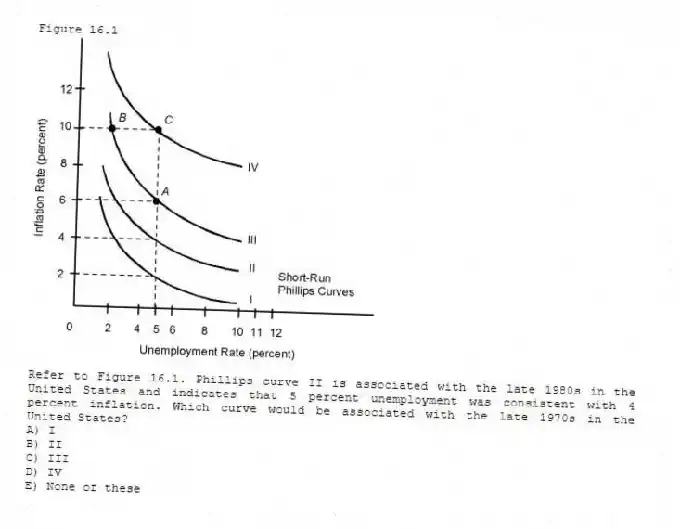
Figure 16.1
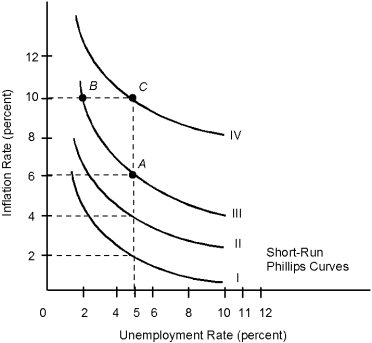
-Refer to Figure 16.1. Phillips curve II is associated with the late 1980s in the United States and indicates that 5 percent unemployment was consistent with 4 percent inflation. Which curve would be associated with the late 1970s in the United States?
A) I
B) II
C) III
D) IV
E) None of these
Correct Answer:
Verified
Q11: The Phillips curve suggests a tradeoff between
A)
Q12: U.S. data on unemployment and inflation in
Q13: According to the long-run Phillips curve, which
Q14: The reservation wage is the
A) nominal wage
Q15: Unexpected inflation can affect the unemployment rate
Q17: In the short run, expansionary monetary policy
Q18: If an increase in inflation is expected,
Q19: The short-run Phillips curve for the United
Q20: The slope of the short-run Phillips curve
Q21: The adaptive expectations theory suggests that
A) the
Unlock this Answer For Free Now!
View this answer and more for free by performing one of the following actions

Scan the QR code to install the App and get 2 free unlocks

Unlock quizzes for free by uploading documents