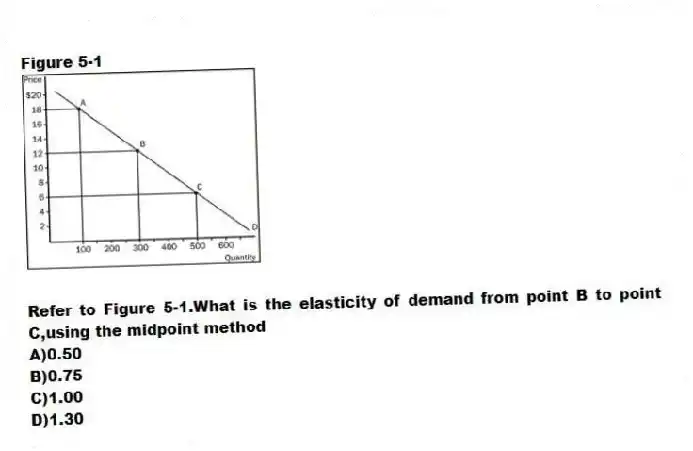
Figure 5-1
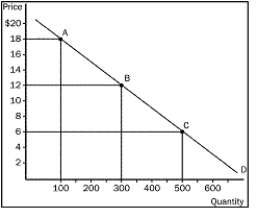
-Refer to Figure 5-1.What is the elasticity of demand from point B to point C,using the midpoint method
A) 0.50
B) 0.75
C) 1.00
D) 1.30
Correct Answer:
Verified
Q30: How do most economists report the elasticity
Q31: Suppose the price of Twinkle snack cakes
Q32: What is the main reason for using
Q33: Suppose there is a 3 percent increase
Q34: How do economists compute the price elasticity
Q36: When the local used bookstore prices economics
Q37: When the price of kittens was $20
Q38: When the price of bubble gum is
Q39: Why is the midpoint method used to
Q40: If a 5 percent increase in price
Unlock this Answer For Free Now!
View this answer and more for free by performing one of the following actions

Scan the QR code to install the App and get 2 free unlocks

Unlock quizzes for free by uploading documents