Multiple Choice
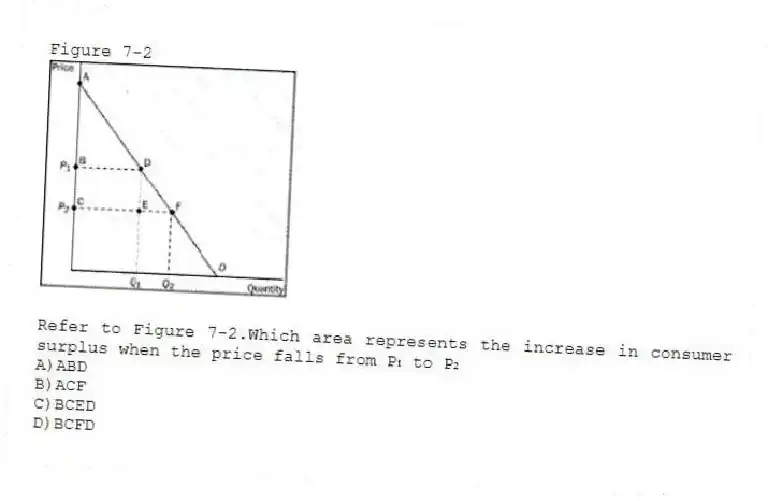
Figure 7-2
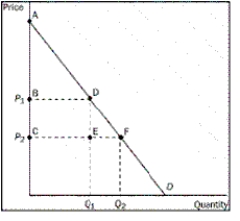
-Refer to Figure 7-2.Which area represents the increase in consumer surplus when the price falls from P₁ to P₂
A) ABD
B) ACF
C) BCED
D) BCFD
Correct Answer:
Verified
Related Questions
Q41: If the price of oak lumber increases,what
Q42: Suppose a consumer is willing and able
Q43: Suppose that Dylan has a change in
Q44: On a graph,which area is consumer surplus
A)the
Q45: Figure 7-2 Q47: What happens to consumer surplus if the Q48: Figure 7-1 Q49: When technology improves in the ice cream Q50: Figure 7-1 Q56: Figure 7-2 Unlock this Answer For Free Now! View this answer and more for free by performing one of the following actions Scan the QR code to install the App and get 2 free unlocks Unlock quizzes for free by uploading documents
![]()
![]()
![]()
![]()

