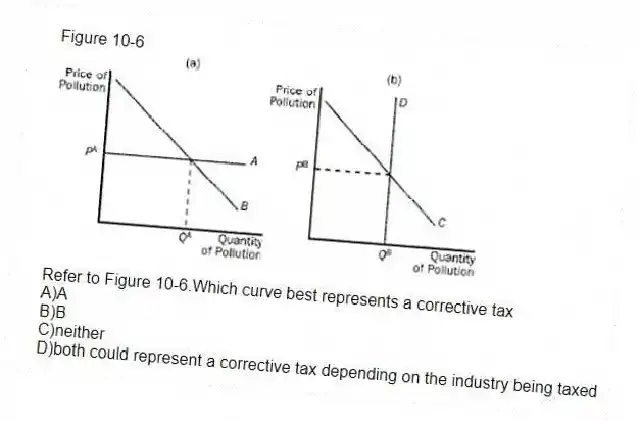
Figure 10-6
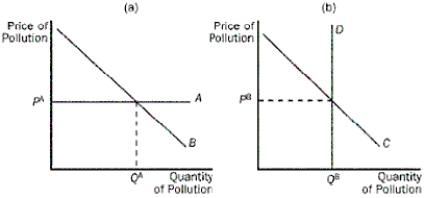
-Refer to Figure 10-6.Which curve best represents a corrective tax
A) A
B) B
C) neither
D) both could represent a corrective tax depending on the industry being taxed
Correct Answer:
Verified
Q118: How do corrective taxes differ from most
Q119: What does a corrective tax do
A)It places
Q120: What are the benefits of using corrective
Q121: What is one advantage of allowing a
Q122: Two firms,A and B,each currently dump 50
Q124: In some cases,why might pollution permits be
Q125: A local pub that allowed patrons to
Q126: When one firm sells its pollution permit
Q127: What are two ways to reduce pollution
Q128: If the government were to limit the
Unlock this Answer For Free Now!
View this answer and more for free by performing one of the following actions

Scan the QR code to install the App and get 2 free unlocks

Unlock quizzes for free by uploading documents