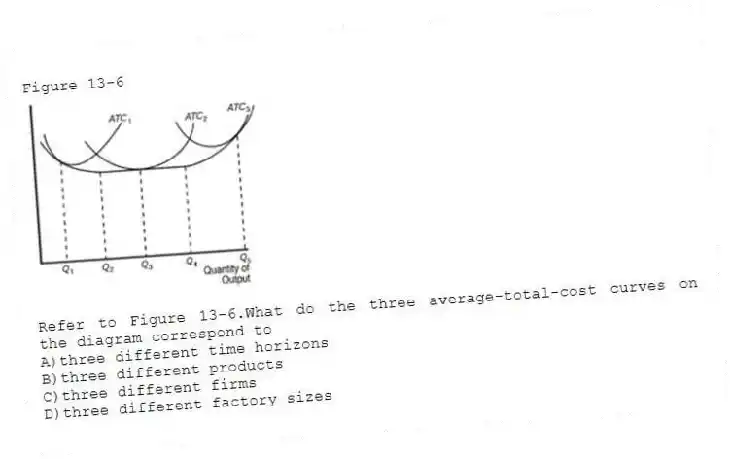
Figure 13-6
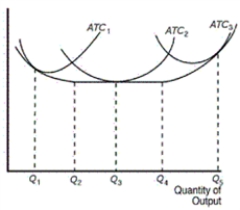
-Refer to Figure 13-6.What do the three average-total-cost curves on the diagram correspond to
A) three different time horizons
B) three different products
C) three different firms
D) three different factory sizes
Correct Answer:
Verified
Q140: Table 13-3 Q141: Which of the following situations does a Q142: Figure 13-5 Q143: Figure 13-6 Q144: When does specialization among workers occur Q146: When do economies of scale arise Q147: Why are long-run average-total-cost curves often U-shaped Q148: Which of the following can be explained Q149: Figure 13-5 Q150: In reference to setting the production level,what![]()
This figure depicts average total cost
![]()
A)when each
A)when an
A)for
This figure depicts average total cost
Unlock this Answer For Free Now!
View this answer and more for free by performing one of the following actions

Scan the QR code to install the App and get 2 free unlocks

Unlock quizzes for free by uploading documents