
Figure 15-2
The figure below reflects the cost and revenue structure for a monopoly firm.
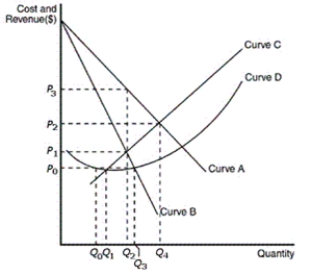
-Refer to Figure 15-2.Which curve depicts the marginal-cost curve for a monopoly firm
A) A
B) B
C) C
D) D
Correct Answer:
Verified
Q59: When a monopolist increases the amount of
Q60: A monopoly firm can sell 150 units
Q61: Figure 15-2
The figure below reflects the cost
Q62: Figure 15-3
The figure below reflects the cost
Q63: For a monopoly firm,which of the following
Q65: Suppose a certain firm has a monopoly
Q66: Figure 15-2
The figure below reflects the cost
Q67: How do economists assume that monopolists behave
A)as
Q68: Figure 15-2
The figure below reflects the cost
Q69: Figure 15-3
The figure below reflects the cost
Unlock this Answer For Free Now!
View this answer and more for free by performing one of the following actions

Scan the QR code to install the App and get 2 free unlocks

Unlock quizzes for free by uploading documents