Figure 15-5 the Figure Depicts the Demand, Marginal-Revenue, and Marginal-Cost Curves of Curves

Figure 15-5
The figure depicts the demand, marginal-revenue, and marginal-cost curves of a profit-maximizing monopolist.
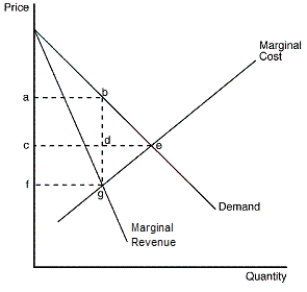
-Refer to Figure 15-5.What is total surplus lost due to monopoly pricing
A) triangle bde
B) triangle bge
C) rectangle acdb
D) rectangle cfgd
Correct Answer:
Verified
Q105: Consider a profit-maximizing monopoly pricing under the
Q106: When a pharmaceutical company discovers a new
Q107: In comparison to the price a competitive
Q108: When do generic drugs enter the pharmaceutical
Q109: If a monopoly sells a quantity of
Q111: What is the amount that producers receive
Q112: Figure 15-5
The figure depicts the demand, marginal-revenue,
Q113: For a profit-maximizing monopolist,when should output be
Q114: For a monopoly market,what is the definition
Q115: What can measure the economic inefficiency of
Unlock this Answer For Free Now!
View this answer and more for free by performing one of the following actions

Scan the QR code to install the App and get 2 free unlocks

Unlock quizzes for free by uploading documents