Multiple Choice

Figure 16-2
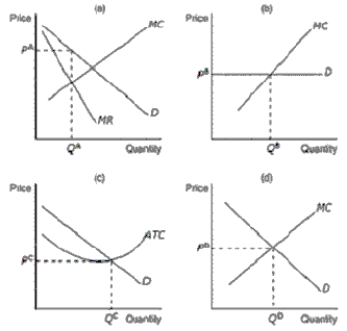
-Refer to Figure 16-2.Which of the graphs would most likely represent a profit-maximizing firm in a monopolistically competitive market
A) panel (a)
B) panel (b)
C) panel (c)
D) panel (d)
Correct Answer:
Verified
Related Questions
Q52: What is one way in which monopolistic
Q53: What happens when a profit-maximizing firm in
Q54: What type of demand curve does product
Q55: Figure 16-3 Q56: When a firm exits a monopolistically competitive
![]()
Unlock this Answer For Free Now!
View this answer and more for free by performing one of the following actions

Scan the QR code to install the App and get 2 free unlocks

Unlock quizzes for free by uploading documents