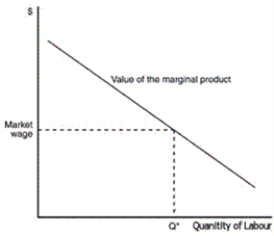
Figure 18-1
The figure represents the value of marginal product for a firm that sells its product in a competitive market.

-Refer to Figure 18-1.The value of the marginal-product curve shown in this figure is the same as which of the following
A) the labour-supply curve
B) the labour-demand curve
C) the marginal-revenue curve
D) the total-revenue curve
Correct Answer:
Verified
Q38: Table 18-1 Q39: The profit from an additional worker is Q40: Table 18-1 Q41: A profit-maximizing firm starts with 100 employees Q42: A profit-maximizing,competitive firm will hire an additional Q44: What does a profit-maximizing competitive firm experience Q45: Up to what point does a competitive,profit-maximizing Q46: What is diminishing marginal product closely related Q47: What is the shape of the curve Q48: What is most likely if a profit-maximizing
![]()
![]()
Unlock this Answer For Free Now!
View this answer and more for free by performing one of the following actions

Scan the QR code to install the App and get 2 free unlocks

Unlock quizzes for free by uploading documents