
Figure 18-1
The figure represents the value of marginal product for a firm that sells its product in a competitive market.
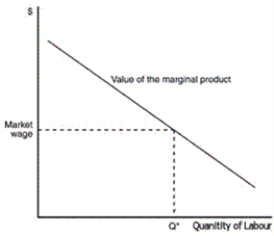
-Refer to Figure 18-1.The shape of the curve suggests the presence of which of the following
A) increased productivity with increased labour
B) diminishing returns to scale
C) increasing marginal utility
D) diminishing marginal product
Correct Answer:
Verified
Q52: When a firm's only input is labour,what
Q53: Figure 18-1
The figure represents the value of
Q54: For the profit-maximizing,competitive firm,what do we know
Q55: What most easily explains the shape of
Q56: A competitive firm will hire workers up
Q58: Typically,as a firm hires additional workers,what happens
Q59: Figure 18-1
The figure represents the value of
Q60: To maximize profit,a competitive firm will hire
Q61: A competitive firm sells its output for
Q62: If consumers demand more genetically engineered foods,what
Unlock this Answer For Free Now!
View this answer and more for free by performing one of the following actions

Scan the QR code to install the App and get 2 free unlocks

Unlock quizzes for free by uploading documents