
Figure 18-3
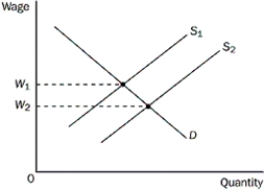
-Refer to Figure 18-3.What could possibly explain the shift of the labour supply curve from S₁ to S₂
A) an increase in technology
B) a change in the price of firms' output
C) a change in workers' attitudes toward the work-leisure trade-off
D) an increase in workers' productivity
Correct Answer:
Verified
Q108: Figure 18-4 Q109: Figure 18-4 Q110: Which of the following best describes the Q111: What is a market in which there Q112: Figure 18-2 Q114: If one were to consider a university Q115: Figure 18-2 Q116: Suppose medical research provides evidence that eating Q117: When a labour market is a monopsony,what Q118: Figure 18-4 Unlock this Answer For Free Now! View this answer and more for free by performing one of the following actions Scan the QR code to install the App and get 2 free unlocks Unlock quizzes for free by uploading documents
![]()
![]()
![]()
![]()
![]()

