Multiple Choice

Figure 21-2
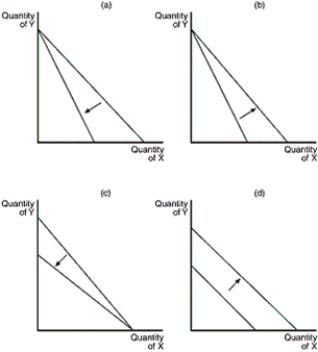
-Refer to Figure 21-2.Which of the graphs in the figure reflects an increase in consumer's income
A) graph (a)
B) graph (b)
C) graph (c)
D) graph (d)
Correct Answer:
Verified
Related Questions
Q3: Figure 21-1 Q4: What can we say about a consumer Q5: Assume that a college student spends all Q6: Figure 21-2 Q7: What does the theory of consumer choice Q9: Figure 21-2 Q10: Consider two goods: pizza and cola.What is Q11: Assume that a college student spends all Q12: Assume that a college student spends all Q13: Figure 21-1 Unlock this Answer For Free Now! View this answer and more for free by performing one of the following actions Scan the QR code to install the App and get 2 free unlocks Unlock quizzes for free by uploading documents
![]()
![]()
![]()
![]()

