Figure 4-14 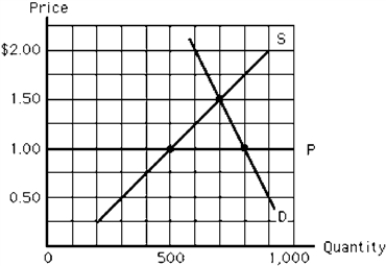
-Figure 4-14 depicts the milk market. The horizontal line, P, represents a price ceiling imposed by the government. Which of the following is true?
A) In equilibrium, the quantity demanded is 800 gallons.
B) At the ceiling price, there is a surplus.
C) The quantity demanded at the price ceiling will equal the quantity supplied.
D) The equilibrium price would be $1 per unit without the price ceiling.
E) The quantity sold will be 500 gallons.
Correct Answer:
Verified
Q43: Figure 4-17 Q44: Figure 4-16 Q45: Use the figure below to answer the Q46: Use the figure below to answer the Q47: Use the figure below to answer the Q49: Use the figure below to answer the Q50: Figure 4-18 Q51: Use the figure below to answer the Q52: Use the figure below to answer the Q53: Figure 4-17 Unlock this Answer For Free Now! View this answer and more for free by performing one of the following actions Scan the QR code to install the App and get 2 free unlocks Unlock quizzes for free by uploading documents![]()
![]()
![]()
![]()

