Multiple Choice
Figure 3-17
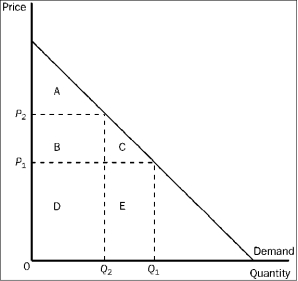
-Refer to Figure 3-17.Area C represents
A) the decrease in consumer surplus that results from a downward-sloping demand curve.
B) consumer surplus to new consumers who enter the market when the price falls from P₂ to P₁.
C) the increase in producer surplus when quantity sold increases from Q₂ to Q₁.
D) the decrease in consumer surplus to each consumer in the market when the price increases from P₁ to P₂.
Correct Answer:
Verified
Related Questions

