Multiple Choice
Use the figure below to answer the following question(s) .
Figure 4-10 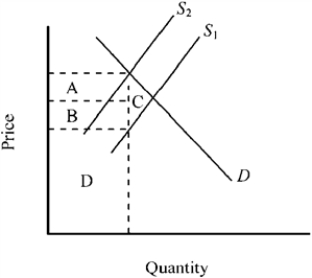
-Refer to Figure 4-10. The accompanying graph shows the market for a good before and after an excise tax is imposed. The total tax revenue generated is indicated by
A) area A + area B + area D.
B) area A + area B + area C.
C) area A + area B.
D) area D only.
Correct Answer:
Verified
Related Questions

