The figure below depicts the demand, marginal revenue and marginal cost curves of a profit-maximizing monopolist.
Figure 11-15 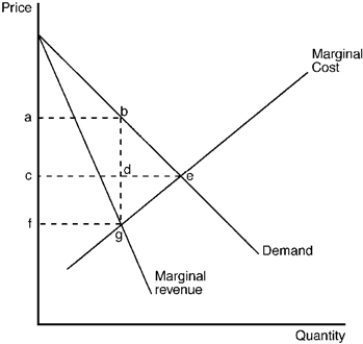
-Refer to Figure 11-15. Which of the following areas represents the deadweight loss due to monopoly pricing?
A) Triangle bde
B) Triangle bge
C) Rectangle acdb
D) Rectangle cfgd
Correct Answer:
Verified
Q91: Figure 11-18 Q92: Figure 11-17 Q93: Use the figure to answer the following Q94: Figure 11-17 Q95: Figure 11-17 Q97: Use the figure to answer the following Q98: Figure 11-17 Q99: Use the figure to answer the following Q100: Figure 11-19 Q101: Which of the following is true? Unlock this Answer For Free Now! View this answer and more for free by performing one of the following actions Scan the QR code to install the App and get 2 free unlocks Unlock quizzes for free by uploading documents![]()
![]()
![]()
![]()
![]()
![]()
A) Competitive

