Figure 8-1 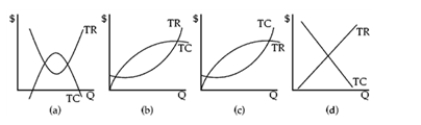
-Which graph in Figure 8-1 shows a typical firm's total revenue and total cost curves?
A) (a)
B) (b)
C) (c)
D) (d)
Correct Answer:
Verified
Q122: Thomas Edison once said that he began
Q123: Average cost equals
A)change in total cost/change in
Q124: Bob goes to his favorite hot dog
Q125: Whenever average cost exceeds marginal cost,
A)average cost
Q126: Marginal cost
A)equals the slope of the total
Q128: If the output of a firm is
Q129: The total cost curve generally has
A)slope values
Q130: Figure 8-2 Q131: At its current level of output, a Q132: Figure 8-3 ![]()
![]()
Unlock this Answer For Free Now!
View this answer and more for free by performing one of the following actions

Scan the QR code to install the App and get 2 free unlocks

Unlock quizzes for free by uploading documents