Figure 12-4
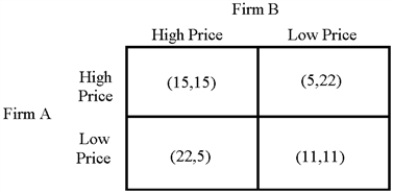
-The above matrix (Figure 12-4) displays the possible profit results of two firms, A and B, from following two different possible strategies: charging a high price and charging a low price.In each cell, the first number is the profit of firm A, and the second number is the profit of firm B.
a.Assume that collusion is not possible.Determine the optimal strategy for each firm.Explain why it is the best strategy to follow.
a., explain why firms collude.What are the pitfalls of collusion?
b.Based on your answer to
Correct Answer:
Verified
View Answer
Unlock this answer now
Get Access to more Verified Answers free of charge
Q224: How will price, output, and profit compare
Q230: Can positive economic profits persist under monopolistic
Q242: Explain the prisoner's dilemma case in game
Q243: Firms in a perfectly contestable market will
Q244: The airline dominating Charlotte, North Carolina, once
Q245: Explain how a large number of firms
Q246: When an airline reduces its fares, other
Q247: Why is oligopoly more difficult to model
Q248: What are the four types of industry
Q253: Which oligopoly model leads to price rigidity?
Unlock this Answer For Free Now!
View this answer and more for free by performing one of the following actions

Scan the QR code to install the App and get 2 free unlocks

Unlock quizzes for free by uploading documents