Multiple Choice
Figure 9-3
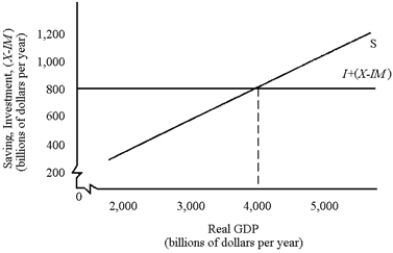
-In Figure 9-3, saving at equilibrium GDP is
A) $1,200 billion.
B) $1,000 billion.
C) $800 billion.
D) $600 billion.
E) $400 billion.
Correct Answer:
Verified
Related Questions
Q127: Which of the following would be associated
Q128: Table 9-1 Q129: A recessionary gap and an inflationary gap Q130: A major reason for the existence of Q131: In the basic 45° line model, what![]()

