Multiple Choice
Figure 11-3
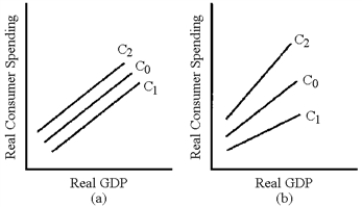
-In Figure 11-3, which line represents the change in the consumption schedule caused by an increase in the residential property tax?
A) C₁ in graph (a)
B) C2 in graph (a)
C) C₁ in graph (b)
D) C2 in graph (b)
Correct Answer:
Verified
Related Questions

