Multiple Choice
Figure 22-7
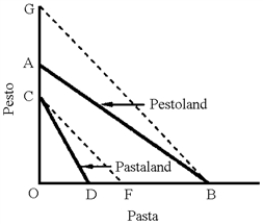
-In Figure 22-7, AB represents the production possibilities of Pestoland and CD that of Pastaland.In this graph, Pestoland has a comparative advantage in
A) pasta because OA/OB < OC/OD.
B) pesto because OA/OB < OC/OD.
C) pasta because OA/OB OC/OD.
D) pesto because OA/OB OC/OD.
Correct Answer:
Verified
Related Questions
Q121: Figure 22-7 Q122: Figure 22-6 Q123: Using graphs to illustrate the concepts, absolute
![]()
![]()

