Figure 20-1
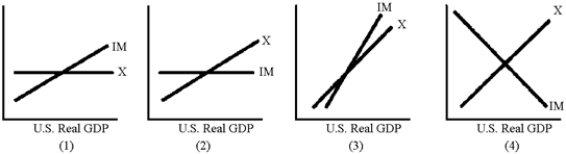
-Which of the graphs in Figure 20-1 best illustrates the behavior of exports and imports in relation to U.S.real GDP?
A) 1
B) 2
C) 3
D) 4
Correct Answer:
Verified
Q36: The sum of capital inflows and the
Q37: International capital flows tend to reduce the
Q38: The United States can reduce its trade
Q39: International capital flows tend to strengthen the
Q40: An expansionary fiscal policy makes the exchange
Q42: An increase in the price level in
Q46: A favorable supply shock abroad would
A)increase U.S.imports
Q48: If Asian economies suffer a serious economic
Q50: An increase in the value of the
Q60: Which of the following is correct?
A)IM +
Unlock this Answer For Free Now!
View this answer and more for free by performing one of the following actions

Scan the QR code to install the App and get 2 free unlocks

Unlock quizzes for free by uploading documents