Multiple Choice
Figure 20-8
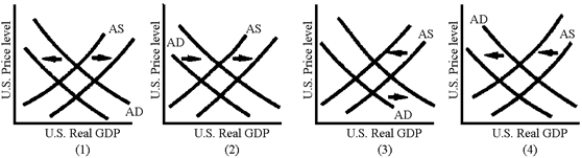
-Which of the graphs in Figure 20-8 illustrates the AD-AS shifts induced by the foreign sector following an increase in the U.S.federal deficit?
A) 1
B) 2
C) 3
D) 4
Correct Answer:
Verified
Related Questions
Q142: An expansionary monetary policy will
A)increase imports.
B)decrease exports.
C)increase
Q145: Figure 20-7 Q146: Table 20-1 Q146: If the United States increased its budget
![]()
Suppose the economy of Macroland is

