Figure 20-9
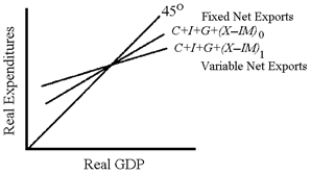
-In Figure 20-9, the C + I + G + (X − IM) 1 line is flatter than the C + I + G + (X − IM) 0 line because the
A) (X − IM) 1 line indicates that net exports decline as GDP rises.
B) (X − IM) 1 line indicates that net exports rise as GDP rises.
C) multiplier is greater for the (X − IM) 1 line.
D) (X − IM) 1 line indicates that tariffs, quotas, and other trade barriers are keeping net exports below their full potential.
Correct Answer:
Verified
Q172: Which of the following is correct?
A)Current account
Q182: Economic theory shows that the current account
Q183: In an open economy, the government deficit
Q186: The U.S.trade deficits of the 1980s and
Q189: In an open economy, the government deficit
Q191: How does a budget deficit lead to
Q192: The trade deficits of the 1980s and
Q195: The worst remedy for curing the U.S.trade
Q198: The saving rate in the United States
Q213: Discuss the opposing points of view on
Unlock this Answer For Free Now!
View this answer and more for free by performing one of the following actions

Scan the QR code to install the App and get 2 free unlocks

Unlock quizzes for free by uploading documents